
Strategy Builder
👤 Who
This guide is for users who are wanting to recommend strategies, update strategy text and compare projections.
Role type required: Any
❗The Fact Find must be locked in order to use Strategy Builder.
❗The iff modeller license is required to view modelling for any created scenarios.
📌 What is Strategy Builder
Strategy Builder allows you to recommend strategies, update strategy text and compare projections. You can add up to 3 different scenarios and utilise the comparison tools to determine the recommended scenario for your client. Strategy Builder provides users with two key indicators that can be used to compare strategies and scenarios:
- The Asset Score - represents the percentage of the simulations that result in Net Assets at life expectancy being greater than $0.
- The Cashflow Score - evaluates the median simulation and calculates the percentage of periods with a net surplus cashflow.
💡The figures displayed within the view modelling charts and tables are derived from the median simulation. Further information on iff's modeling engine can be found here.
🏦The Asset Score
A stochastic model and monte carlo simulation is utilised to produce the ‘Asset Score’, being the number of simulations that result in net assets at life expectancy being greater than $0. This is effectively the percentage of positive net asset simulations.
The blue lines represent simulations that result in a net asset position greater than $0 at life expectancy. Whereas each red line illustrates a simulation that results in a net asset position less than or equal to $0 at life expectancy.
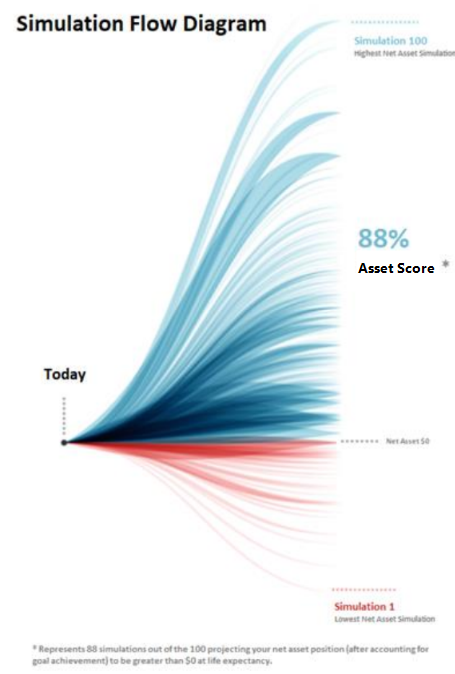
Above diagram is not a chart of the simulations, instead is an illustration of the start and endpoints of projections. Near simulations are joined and shaded for aesthetics only (to make the plotted lines look more wave or hair like).
💲The Cashflow Score
The Cashflow Score evaluates the median simulation and calculates the percentage of periods with a net surplus cashflow. For example, a Cashflow Score of 75 means that 75% of the periods in the projection have a net surplus cashflow of $0 or more.